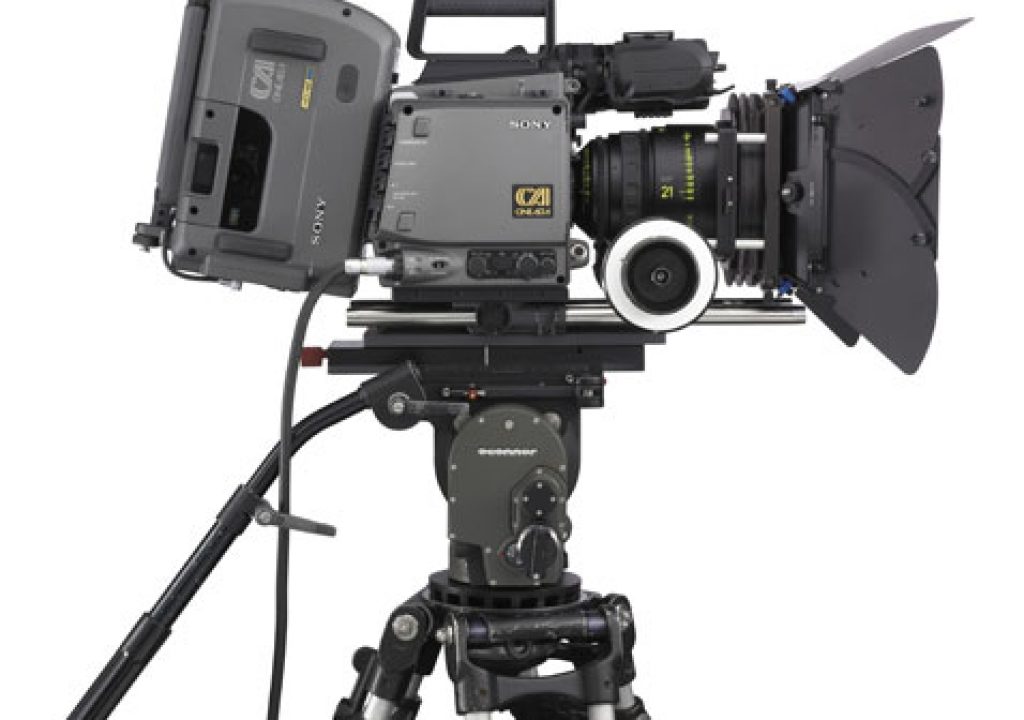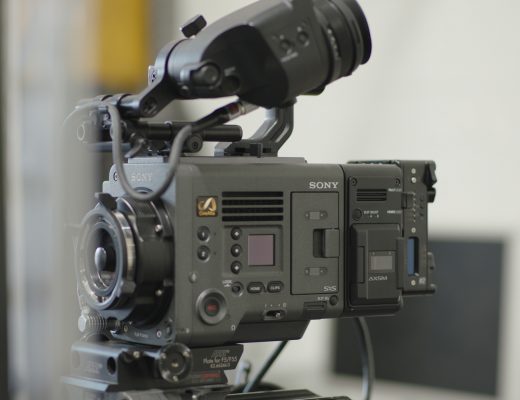
The RED ONE is cheap and good; the Sony F35 is expensive and utterly amazing.
Way back in November 2008, as banks melted around us and elaborate Ponzi schemes mailed out their last round of dividend checks, I participated in a series of tests of the Sony F35. Initially I worked with Jim Rolin (chief engineer and co-owner of Videofax in San Francisco) and Adam Wilt in doing some tests of various built-in and custom gamma curves, which resulted in the completion of a short spec spot. Later Jim and I got together and performed over-and-underexposure latitude tests to see how much dynamic range we could squeak out of the camera.
We were extremely impressed with the results and told all, far and wide, what we’d discovered. Following the rule of “Let no good deed go unpunished” we were asked to present these test results to the Northern California Chapter of the Digital Cinema Society at their December meeting, which was held on the Apple Computer campus. The entire event was videotaped, and as all of us came across reasonably well the final edit will appear shortly on the Digital Cinema Society web site. Meanwhile I’ve been asked by several people to write up my impressions of the camera in advance of my small screen debut.
This is not meant to be a highly technical document, yet there are some parts that may make one’s brain hurt. Stick with me. There’s no complex math, and I’ve done my best to explain things as simply as possible. If you have a desire to learn, at a basic level, generally how modern HD cameras work, and some specifics as to how the Sony F35 works, then put your brave face on and turn the page.
SLICED BREAD, MOVE OVER!
The F35 is amazing. Which it should be, as it costs around $200k. It is very much designed to be used film-style, utilizing a Super 35mm-sized sensor and no filter wheel. The built-in gamma curves will work to the satisfaction of nearly everyone, and the options for additional curves are attractive both in terms of cost and added benefit.
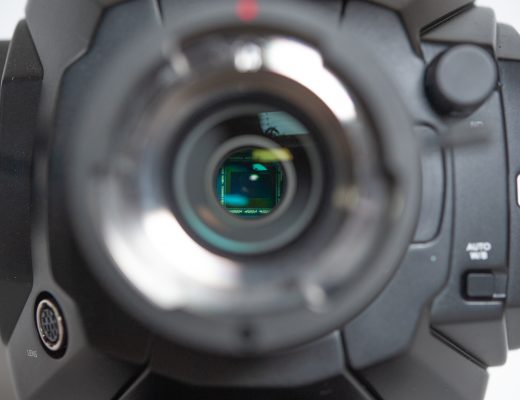
The most interesting part of the camera is the sensor. Silicon sensors only detect brightness, not color, so to derive a color from brightness only each photosite has a small colored filter over it that is either red, green or blue. By detecting how much light comes through the filter a processor can determine how much of red, green or blue is being detected.
Cameras with prism blocks can detect red, green and blue for every point in the image because the image is split three ways, through a prism, and directed to three different sensors, each with a red, green and blue filter in front of it. Each sensor sees a full 1920×1080 image, filtered by its individual color, and those three separately-colored images are combined into one image where each point has a real red, green and blue value.
Single-sensor cameras have a potential flaw in that they can’t see three colors in one spot at the same time, because each photosite, or light sensitive point on the sensor, can only be filtered with one color at a time. One common solution to this problem is the Bayer pattern sensor, which samples clusters that contain two green photosites for every blue and red one. (The RED is an example of a camera with a Bayer pattern sensor, as is the Vision Research Phantom HD, Silicon Imaging SI-2K and Arri D20/D21 cameras.)
Bayer pattern sensors work fairly well but suffer from lower resolution in the blue and red channels, as there are twice as many green photosites as there are for red and blue. Bayer pattern data also requires a lot of processing power in post: as each photosite samples only one color, a complex algorithm examines surrounding photosites and makes an educated guess as to what the other two color values should be for that one point on the sensor.
Keep in mind that a photosite is actually the physical point on the sensor at which light is gathered, which is not the same as a pixel. Pixel is shorthand for “picture element”, which is really a point sample of one or more photosites.
In the case of a Bayer pattern, for example, one pixel representing a green photosite will be assigned additional values for blue and red based on the values of the red and blue photosites surrounding it. The algorithm basically guesses at the missing values in order to make that green photosite appear as a full RGB pixel. That means storing less information during shooting because each photosite only has one value (either R, G or B), but it also means processing each photosite into a full-color RGB pixel in post, and that can take a lot of computer processing time.
The F35 RGB-striped sensor design is quite ingenious. It is arranged 2160 photosites vertically and 5760 photosites horizontally–or twice the vertical resolution and three times the horizontal resolution of a normal 1920×1080 HD raster. The photosite columns alternate colors: one column sees only red, the next sees only green, and the last sees only blue, and that sequence repeats horizontally across the surface of the chip.
Each pixel is created out of six photosites: two rows of red, green and blue are sampled vertically, and then those values are shifted horizontally to fall on top of each other. Imagine that these are the first two rows and three columns of photosites on the sensor:
R G B
R G B
First the two rows are added together vertically:
RR GG BB
Then the results are shifted on top of each other, so that R and G move right to stack on top of B. That becomes one pixel with a red, green and blue value derived from roughly the same spot on the chip:
RGB
Adding the signals from the two vertical photosites reduces noise significantly by doubling the color’s signal strength. Noise is random, which means that two random noise values added together never equals double the noise, so the color values are given a boost above the noise to create a very clean signal.
This is probably the most efficient and accurate method of sampling RGB pixel values across a single sensor. The usual three-chip prism block, with three sensors arranged around a prism block, provides three true RGB values for each pixel but suffers from two major anomalies:
(1)white shading errors, which are attributable to the use of an RGB prism block and result in green/magenta fringing around highlights, and
(2)increased depth-of-field due to using sensors that are roughly the size of a Super 16mm film frame.
The F35’s single sensor allows the use of 35mm film lenses and provides for 35mm reduced depth-of-field, which on the surface are the most obvious benefits of using this camera.
The problem is that the sensor is too good for our legacy broadcasting standards. The solution starts on the next page…
CRAMMING 12 STOPS INTO A FIVE STOP BUCKET
Anyone who is familiar with the menu system of a Sony F900R already knows the vast majority of the menus in the F35. Several of the primary gamma curves are roughly the same. We’ll go into those in a moment. But first, let’s talk about why we need aggressive gamma curves.
The original HD spec is based on the old NTSC television standard of five stops of dynamic range, encompassing 0-100% on waveform monitor. That’s it. The Rec 709 HD standard only allows for about 2.5 stops of overexposure latitude, between approximately 45% (or 18% “middle” gray) up to 109%, as seen on a waveform monitor.
Our happy misfortunate is that sensors have become much, much better and can now see well beyond the five stops of latitude provided for in Rec 709, but all of our engineering and monitoring tools and data pipelines (HD-SDI) are designed around the Rec 709 legacy of having a 0%-109% “bit bucket”. At a demonstration of the Sony F23 held by Videofax in 2007, local video engineer Fred Meyers described how he came up with the concept of the bit bucket while doing tests for the film Speed Racer. “The trick,” he said, “is not only using the biggest bucket possible, but making sure you fill it all the way.” We’ll talk about this a bit more when we start comparing curves.
How do we cram a total of 12+ stops of dynamic range into a five stop bit bucket?
Those of you who said “bigger hammers” are banished to the grip truck. The correct is answer is “aggressive gamma curves.”
The following graphs are intended to communicate general ideas and are not exact measurements of anything known to man.
The Rec 709 gamma is a very simple one, and although it has a curve to it it’s easier to envision as a straight line:
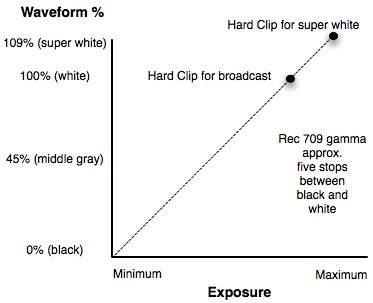
At around two to two-and-a-half stops over middle gray, exposure hits a hard ceiling and clips. This is completely unlike film, where at some point one stop of exposure change does not result in a one stop difference on film–and the highlights slowly and gradually lose detail until they disappear into featureless white.
Knee circuits help somewhat but never really do the trick. They try to create an artificial slope that’s shallower than the Rec 709 curve but doesn’t roll off gently the way film does:
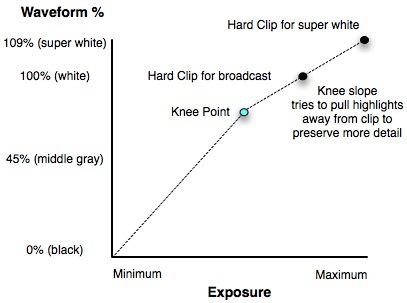
Knee circuits are notorious for causing color distortions in highlights, which is why we never use them to reign in highlights on flesh tone: the affected areas tend to turn a metallic green color, which does no one any favors.
A curve is fundamentally different. While a knee circuit is just trying to make blown-out highlights look a little prettier by bringing the exposure in the highlights down in an attempt to make detail visible, curves are actually grabbing extended dynamic range information available on the sensor and remapping it to fit into the confines of the Rec 709 spec:
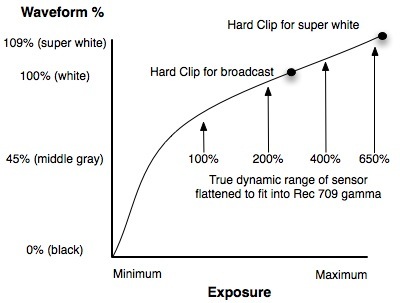
Instead of starting at a knee point and trying to force detail out of bright, desaturated highlights, a curve gently draws information from beyond Rec 709’s normal cutoff down into the 0-109% bit bucket. Sony describes how much information the camera is recording beyond Rec 709’s usual boundaries by displaying a percentage number on the side of the camera. As best I can tell the percentages break down in terms of doubles and halves–the way most everything in photography works:
100% is what would normally have been the broadcast clip point for Rec 709, about two stops over middle gray.
200% is another stop beyond that point that the sensor can see but couldn’t fit into the Rec 709 gamma space without using a curve.
400% is another stop beyond that point.
650% is a normal “limit” to how much information can be pulled off the chip, and represents about a half stop increase beyond 400%, or an additional 2.5 stops of information that normally wouldn’t fit in Rec 709–for a total of 4.5 stops of exposure latitude above middle gray. (In some modes Sony claims a maximum of 800%, or an additional half stop beyond 650%.)
Depending on the curve used and the gain applied the percentage number will increase or decrease, giving you an idea of how much dynamic range the camera offers in that particular operating mode.
What do these curves actually look like? You’ll see on the next page…
ENTER THE HYPERGAMMAS
Hypergamma curves are Sony’s solution for cramming beautiful high dynamic “what you see is what you get” images into the old Rec 709 bit bucket. Here is a visual example of the difference between Rec 709 highlights and Sony Hypergamma curve highlights:
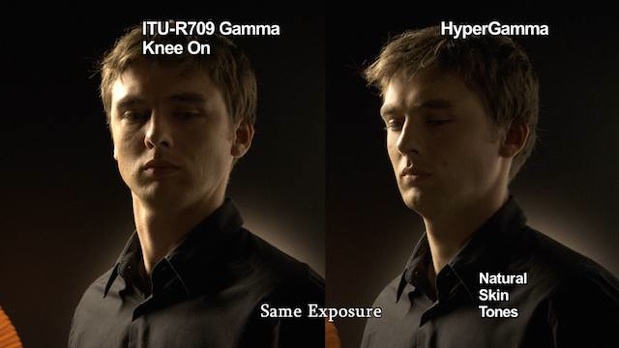
Notice how Rec 709 requires some knee control and still manages to turn this gentleman’s forehead into a nasty clipped mess. The Hypergamma highlight is much smoother and prettier, much more like what we would see by eye.
There are five advanced curves built into the F35 (and F23):
Hypergamma 1: boosts shadow detail and uses range from 0-100% to protect for broadcast clipping. As gain is applied to boost the shadow portion of the curve Sony recommends using -3db gain to “crush” the noise in the blacks. Dynamic range setting at “normal”.
Hypergamma 2: high dynamic range curve good for capturing highlight detail and uses 0-100% range to protect for broadcast clipping. Use at 0db, which is considered normal operating mode for this camera. Dynamic range setting at “normal”.
Hypergamma 3: same as Hypergamma 1 but allows for additional dynamic range and a bigger bit bucket by using the super white range between 100% and 109%. This assumes that the footage will not be broadcast or, if it will be broadcast, that the super white range will be brought from 109% down to 100% to retain highlight detail. Use -3db gain to crush noise in boosted shadows. Dynamic range setting at “normal”.
Hypergamma 4: same as Hypergamma 2 but uses 0%-109% and does not protect for broadcast clipping but creates a significantly bigger “bit bucket”. Use at 0db. Dynamic range setting at “normal”. This curve is referred to as the “high dynamic range” curve by Sony.
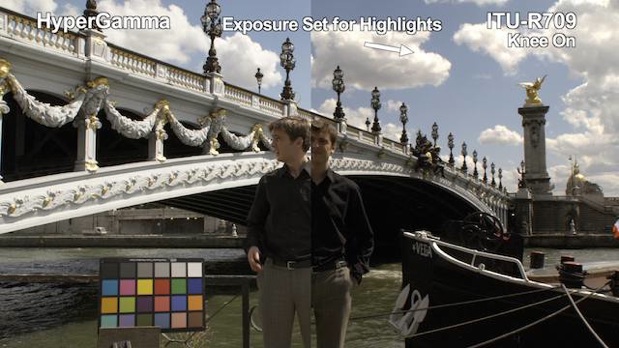
Here’s an example of one of the Hypergamma curves (in this test, shot by Sony France, the exact curve is not identified) compared to the standard Rec/ITU 709 standard gamma curve. In both cases the exposure is set for the brightest highlights. The Rec 709 gamma is unable to hold the full range of shadows to highlights, while the Hypergamma curve (possibly curve 3, judging by the boosted shadow detail under the bridge) increases the dynamic range of the camera by at least several stops.
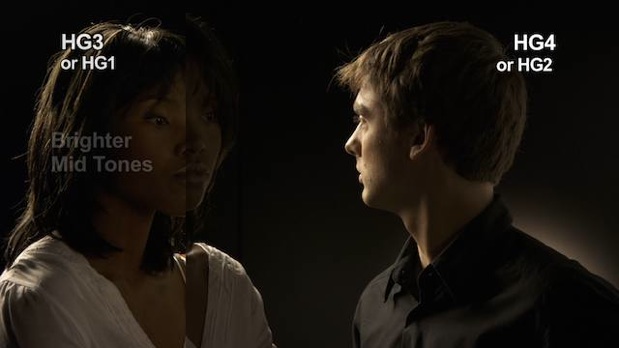
This shows the fundamental difference between the Hypergamma 1 and 3 curves, designed to boost shadow detail, and the Hypergamma 2 and 4 curves, designed for overall high dynamic range (and probably best suited for reigning in highlights).
S-Log captures and stores all data on the sensor into a range between 0-104%:
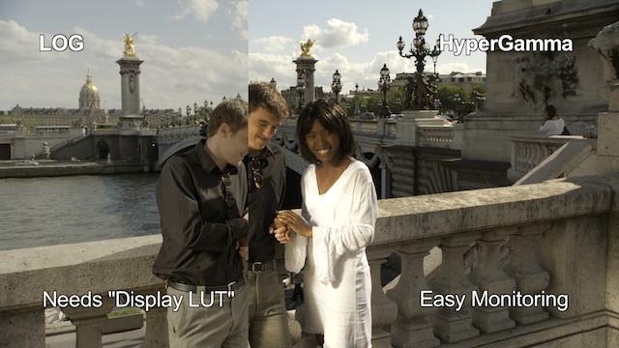
This is the only mode where the dynamic range setting should be changed to “extended”, which boosts the gain to +3db and creates the 0-104% range. (Without extended dynamic range S-Log will only encompass 0-98%. When asked why 104% instead of 109%, I was told that 104% was all that was needed to capture everything off the sensor.) Use of a logarithmic gamma curve allows for capture of all the available dynamic range off the chip but requires a lookup table (LUT) for proper on-set viewing and post color correction. (The BVM-L series of Sony LCD master monitors offers a built-in LUT for viewing S-Log.)
I originally thought that the reason S-Log looks a bit washed out and desaturated was because it was capturing a wider color gamut than could be displayed on a Rec 709 monitor, but the F35 can be set to capture a number of difference gamuts (for digital projection, for example) and the camera still looks washed out when using S-Log and the Rec 709 color space. Sony tells me that the reason for this is that the S-Log curve boosts the black point and the darker tones further up the scale than normal to facilitate post manipulation of shadows, and any time one brings the black level (ped) up above 0% colors are desaturated. This is exactly the opposite of what happens when blacks are crushed, a process that oversaturates colors dramatically.
There are six standard gamma options and a summary of gamma choices awaiting on the next page…
IF YOU WANT VANILLA…
In addition to the Hypergamma and S-Log curves there are six standard built-in gammas under the label “STD”. Identified only by number, they are:
1: equivalent gamma to a standard ENG camcorder
2: equivalent to 4.5 times gain
3: equivalent to 3.5 times gain
4: equivalent to SMPTE-240M
5: equivalent to ITU-709 (Rec 709)
6: equivalent to 5.0 times gain
The reference to gain refers to some amplification that is occurring and affecting the blacks more than any other part of the signal. When viewed on a waveform monitor the signal does shift upwards when going from 3.5x to 4.5x to 5x, but the blacks respond about twice as strongly as the highlights do. At this point I don’t have a firm explanation of what is going on here, but the results are easy to view on a waveform and a good monitor.
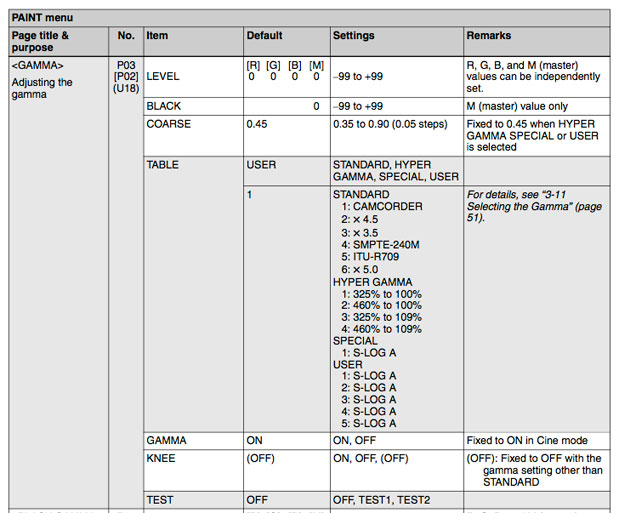
This is the menu tree for the gamma page. If you want to see a little bit of how all the curves work, go to the bottom and turn on “Test 1”. That’s a sawtooth display and shows you, on a gradient from 0-100%, what the gamma is doing. I’ll post another article on this later for those of you without easy access to an F900. (Unfortunately part of the curves are cut off in this mode because the test only goes to 100%, and the full curve goes out to 109%. Still, you’ll get the idea.”Test 2″ shows what’s happening only to the bottom of the curve.)
If you really want a shock, turn gamma off completely. You’ll be amazed at how dark a linear light image is.
These are the lightweight broadcast curves, and may work well for you under low contrast conditions. Super high contrast is another story, and that’s on the next page…
A CURVE FOR ANY OCCASION
Hypergamma curves are designed to be “What You See Is What You Get” curves. Hypergammas allow for knee and ped control, and a skilled DIT/video engineer can manipulate those to fit most shots into the 0-109% “bit bucket” and fill the entire dynamic range. The idea is to fill the bit bucket as fully as possible to preserve the most scene information. (The extra 9% above 100% offers at least an extra stop of highlight latitude, so if you aren’t shooting for broadcast, or if you are and there’s a post production step that can reduce your 109% signal to fit into a 0-100% bucket, you’re well advised to use Hypergammas 3 and 4.)
S-Log is a very aggressive curve that requires post color correction. Middle gray falls very low on the waveform at around 35%, and the image can look somewhat flat if there are no serious highlights. A “normal” scene would fall between 10% and 70% on a waveform monitor, and when I first heard that I was concerned that I was wasting a lot of space that could otherwise be storing more information about highlights and shadows. A chat with George Palmer of HDPIX had me thinking about S-Log a little differently.
A sensor is an analog device, and it imparts information in terms of voltages. As a result, it responds linearly to light: a voltage drop of 50% output from the chip reflects a 50% reduction in the amount of light it sees. The problem is that when these voltage steps are quantized (or digitally broken into small digital steps–in the case of the F35 sensor there are 16,384 digital steps between black and white for each channel, or 14-bits for each of red, green and blue) the first 50% of steps comprise the top full stop of latitude coming off the chip. That means the entire range of 8,192 through 16,384 is dedicated to only the brightest of highlights when that information is taken off the chip.
One of the purposes of gamma is to remap those bits so that they look proper to the eye on a broadcast monitor, because linear gamma looks very dark: the bulk of the information tends to accumulate in the lower voltage levels, which results in a very dark image if it is not gamma corrected. The S-Log curve remaps all that information, in a way that takes advantage of the maximum storage afforded by 10-bit RGB color, by splitting the distribution of brightness such that the mid-tones, where details are the most critical, get the most attention. We don’t need half the available bits to store the top one stop of brightness, nor do we want to cheat our shadows by providing them the fewest possible steps (what’s left over after all the other tones get their allocation). Instead the bits are remapped not based on their original voltages but with the idea of treating the signal like a film negative: put the most bits where the straight line portion of the film curve is (emphasizing the mid-tones) and give fewer bits to the toe and shoulder because the lack of bits won’t be noticed in the extremes of shadow and highlight.
This looks very odd on a standard Rec 709 display but it is the most efficient method of capturing everything available off of a sensor for later processing in post.
The strength of S-Log is that it essentially creates a “digital negative”. I’ve shot several jobs with a director who loves the RED ONE because he doesn’t have to wait for it to be painted. We light, shoot, and move on, and all the color correction is done in post. He feels that he gets the best performances out of actors when he can move that fast, and I can’t argue with him. There are times when a digital negative approach is a distinct advantage.
There are theories that say you give up a little control by shooting in S-Log. While the F35’s paintbox offers very limited control compared to a DaVinci suite, you’ll never have access to that much raw bit depth again. HDCAM SR stores color in 10-bit color depth, which is significantly better than 8-bit HDCAM or DVCProHD, but that’s still a knock-down from the 14-bits coming out of the sensor. And while the sensor is yielding 14-bit color, all the gamma and matrix corrections are applied in the camera’s DSP (digital signal processor) in 36-bit color space–which is a MASSIVE space within which to manipulate 14-bit color. The odds of encountering rounding errors or banding issues while manipulating 14-bit color in a 36-bit color space approaches zero divided by zero.
There are some who may still thing that S-Log doesn’t fill the “bit bucket” all the way by storing so much information in the center of its curve such that the edges are never fully utilized. (It’s very hard to get a highlight to clip in S-Log! Very, very hard.) To satisfy that contingent we’d need an S-Log with adjustable contrast. Fortunately, a company called Digital Praxis has designed that very thing, but in order to find it you’ll have to turn the page…
MY KINGDOM FOR ADJUSTABLE S-LOG
Digital Praxis strove to create curves of varying strengths such that it became possible to fill the full 0-109% bit bucket regardless of scene contrast. At the time I performed my tests at Videofax there were two sets of curves: the “fixed” curves and the “variable” curves.
The diagrams below are intended only to show the general action of the curve on values in the scene and should not be taken literally. Each set of curves has five strengths.
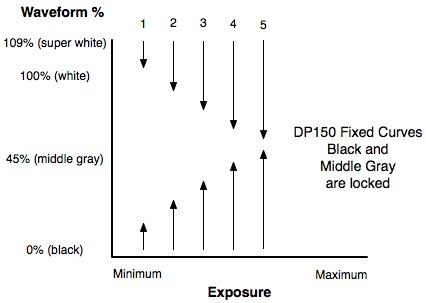
The DP150F (or “fixed”) curves lock out the gamma and ped controls, leaving the lens aperture as the only exposure control over the image. This set of curves locks middle gray to 45% and locks black at 0, and increasing curve strengths (1 through 5, shown above) push the highlight and shadow values toward middle gray. This has the advantage of maintaining mid-tone exposures in a scene while adjusting for changes at the extremes of exposure. If you like where your mid-tones fall then no exposure change should be necessary when switching between these curves.
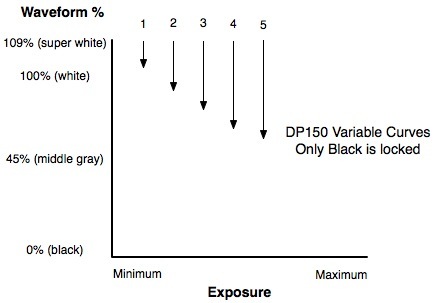
The DP150V (or “variable”) curves also lock out the gamma and ped controls, but the only point of the curve that is locked is black. Higher strengths create an overall flatter curve that pushes the highlights and mid-tones down toward black, almost like a variable S-Log curve. Changing curves requires a change in exposure as both the mid-tones and highlights change in value, while the blacks and dark shadows won’t change as much.
These two sets of curves require the imposition of some sort of knee control somewhere in post to make the highlights roll off in a filmic way. The built-in Hypergamma curves did this, but at the cost of a stop of overexposure latitude, and Jim Rolin and I had a lively discussion as to whether this kind of highlight roll off is something to be done in post, with more latitude captured, or on set, with less latitude but with built-in beautiful highlights.
While designed for post color correction, I’ve had good luck in certain situations using these curves alongside the WYSIWYG Hypergamma curves.
A summary of camera modes and a chart of exposure tests grace the last page of this article, which is on the next page…
CAMERA MODES, EXPOSURE LATITUDE, AND THE END
Meanwhile, back at Videofax, Jim Rolin and I did an exposure test where we exposed the white chip on standard 11-step gray scale chart at middle gray (or 45% on the waveform monitor) and then measured how many stops over to clip and how many stops under before it vanished into noise. Here are the results:
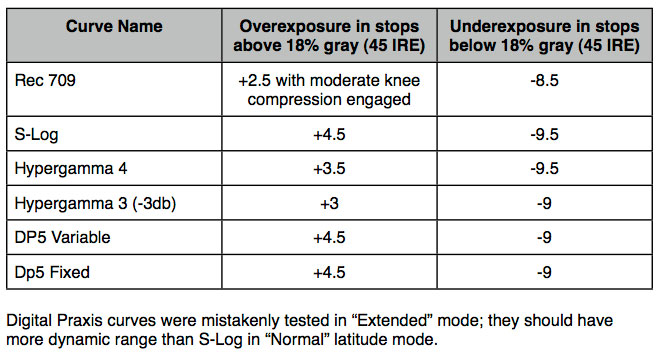
We did make a mistake during testing: we didn’t know what “extended dynamic range” mode was so we left it on, assuming it was a good thing. It wasn’t; it is only supposed to be used with S-Log, and Steve Shaw of Digital Praxis says that his curves should beat S-Log performance when the camera is set to normal dynamic range mode. Still, the results are very impressive.
While some of our measurements indicated a possible dynamic range of 14 stops, the bottom stop or two were very noisy and should not be counted on. It’s probably safer to say that this camera has a consistently usable dynamic range of 12+ stops.
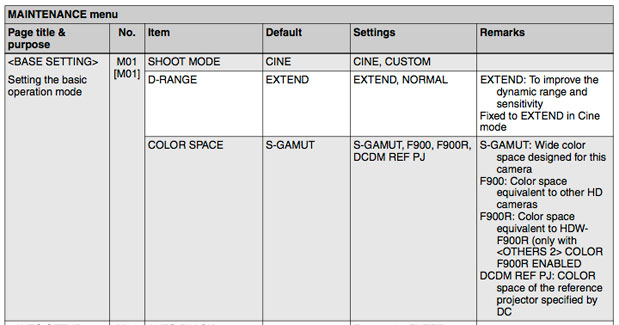
This is the menu tree for the Base Setting menu. Here’s where you have some very basic camera settings:
Shoot Mode: “Cine” disables a significant number of camera controls and is designed to capture a “digital negative” while doing as little to the data as possible, in anticipation of color correction in post. I know very little about this mode as I have not tested it yet. “Custom” allows you to control the camera fully depending on how much control your selected gamma curve (Hypergammas, S-Log, etc.) allow.
D-Range: “Extend” should only be used with the S-Log curve. It has the effect of boosting the overall gain +3db and also increasing the bit bucket for S-Log from 0-98% to 0-104%. “Normal” is for normal operation with Hypergamma, S-Log and custom gamma curves.
Color Space: “S-Gamut” captures an astoundingly wide color gamut that approximates what the human eye can see and must be massaged in post to fit within a veiwable color gamut, like Rec 709, a digital cinema gamut, or whatever. “F900” and “F900R” are Rec 709-compatible color gamuts (I prefer F900R). “DCDM REF JP” is a digital projection standard.
One interesting thing to note is that the underexposure range is pretty consistent between all curves, and that the biggest area of improvement is in the overexposure latitude. HD doesn’t naturally have a curve in the shadows the way film does. Film gradually tapers off into black, going through a portion of the toe curve where a change of one stop in exposure reads as less than that visually until the curve disappears into the noise floor. The HD signal just descends in a straight line until it is overwhelmed by noise. You can add a curve to the lower portion of the HD toe using the black gamma control, but that’s a topic for another article.
My sincere thanks to the following for their help in the creation of this article: Juan Martinez and Dhanendra Patel of Sony, George Palmer of HDPIX, and Adam Wilt of Meets the Eye. Any mistakes or errors should be credited solely to the author. Hypergamma demonstration pictures are the property of Sony, Inc.

Filmtools
Filmmakers go-to destination for pre-production, production & post production equipment!
Shop Now