This is part 6 in a 7-part series on the seven pillars of a strong content market strategy. The first five pillars were knowing the objective, “Be on brand,” picking the right content type, the importance of distribution, and having a solid social media strategy.
In that last installment about social media, I listed seven decision-making parameters for any solid social media strategy. #4 as “Measurement.” Is just so happens that Measurement is the sixth of the seven pillars of a strong content marketing strategy.
What I would like to do in this installment is cover the types of measurement for each kind of major content type and why they’re important.
Video Content
There are a plethora of different ways to measure a video distribution strategy. The value of a video series or a stand-alone video will be determined primarily by the objective. But here is a list of items to measure:
- Impressions: how many times your video’s thumbnail is viewed
- Impression CTR (click-through rate): how many times your thumbnail is clicked
- Views: how many times the video is viewed (based on the minimal length of the video to be classified as a “view” based on the hosting platform.
- Watch time: how many viewers have watched the entire video
- Source: where viewers are located (geo-location)
- Heatmap: which parts of a video were watched
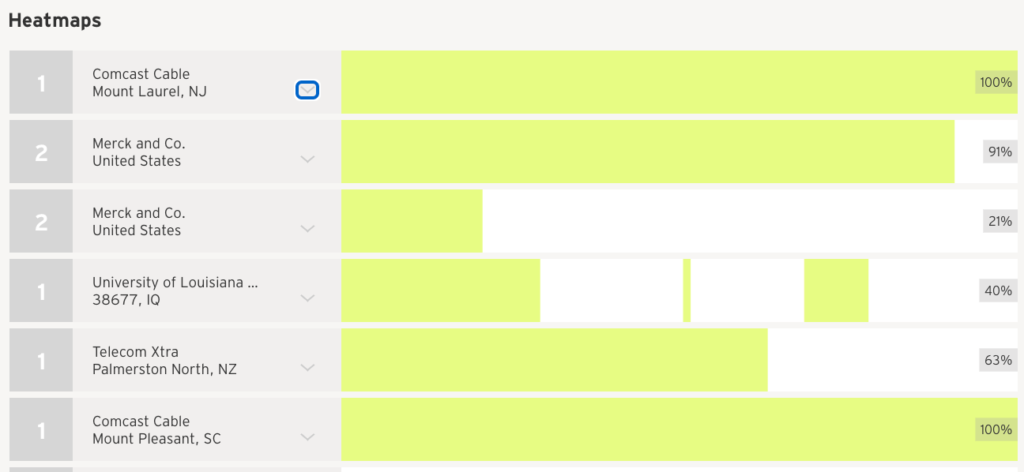
There is any number of different scenarios that might lead to you focusing on one or a few of these parameters over another:
- If you’re producing an educational series, watch time may be of utmost importance because you want to know that the viewers are gaining value. The heatmap would also be extremely important because you may want to see which parts of the education is connecting.
- In addition to watch time, the source of views might be important for a short promotional video. The geographical location, as well as the sociological demographic of those viewers, may have a significant impact on the relative success of a particular video campaign.
- On the surface, you might think the number of Impressions or Impression CTR is not that important; but these figures can give you insight into how effective your thumbnail art is. Also, if a video has a high impression CTR, but little engagement or amount viewed, it could be an indication there’s a disconnect between viewer expectation and what they actually see.
Podcasting
Even though podcasting has been around for over a decade, it’s only in the past three years where we’ve seen such a growth that the consideration to produce one is almost as strong as deciding whether or not to have a blog. There’s been over a 50% increase in U.S. listeners since 2016.
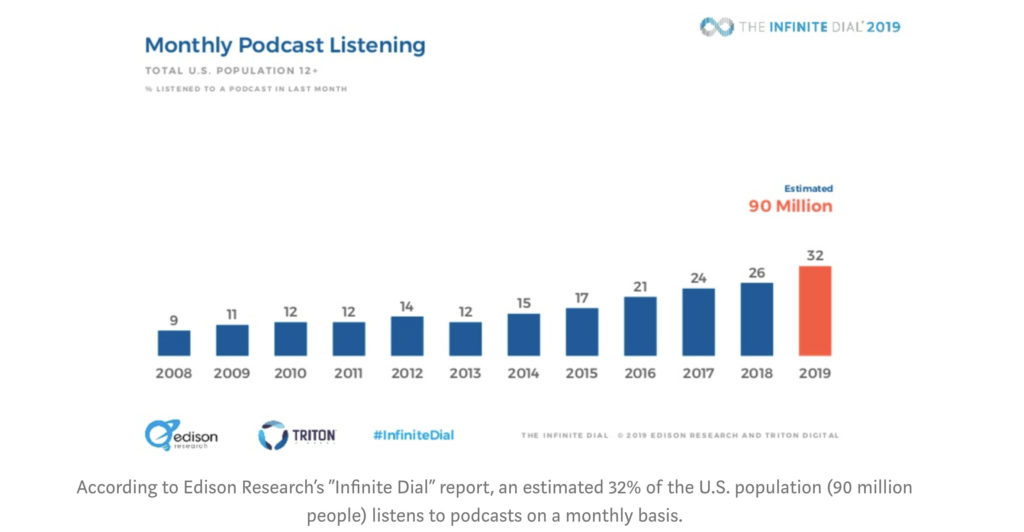
So, if you’re going to join the podcast bandwagon, here are the kind of stats you’ll want to measure:
- Downloads (total and per platform)
- Listens by episode
- Subscribers
- Listens by the time of day
- Location
- Devoice
- OS
One of the benefits of podcasting is that listeners will listen to all or most of each episode. Therefore, podcasting is great for building brand affinity, educating, or entertaining.
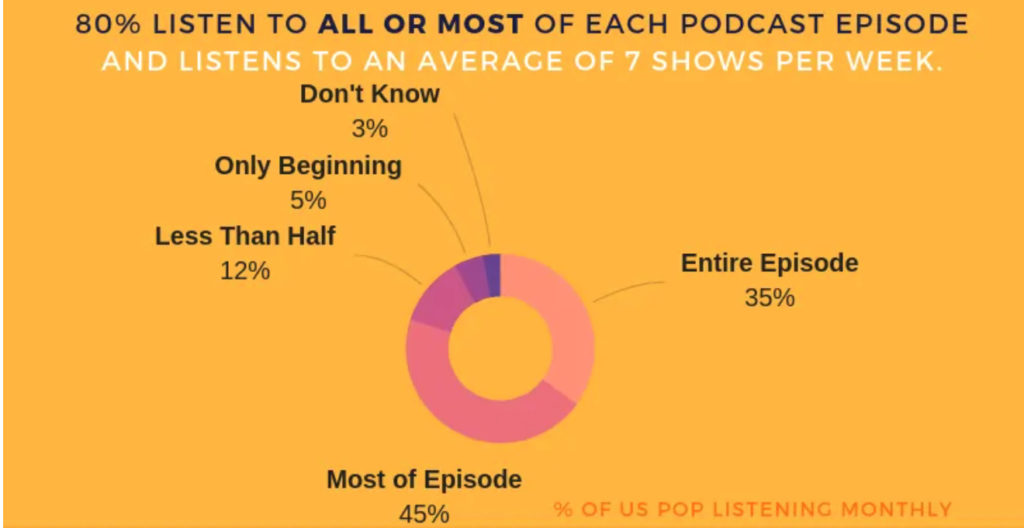
One of the most difficult things to analyze from a podcast is how much of it gets listened to. Unlike videos streamed online, podcasts have to be downloaded to listen to them. Even if you “stream” a podcast via the web or your smartphone, what’s really happening is the file is being progressively downloaded to a temp file in your browser or phone.
To make matters worse, a “download” can come from many sources by the same person. They may download the same podcast on multiple devices; or start listening to an episode online, then finish listening on their phone; etc. For this reason, the Interactive Advertising Bureau (IAB) has stepped in to help standardize measurement. One way they’re doing that is by defining unique downloads. Essentially, this is a system for grouping sets of downloads and attempts from the same app and IP address within a 24-hour period. This theoretically will be the same person, thereby giving you a better indication of how many unique listeners there are.
Analyzing your podcast numbers will give you insights into which types of information and topics your audience prefers, where to invest your ad spend for the shows to get the best return on your investment, and how well you’re executing on your strategy to reach a wider audience.
Email marketing
Email still remains one of the best ways to build an audience. Mainly because you control it. There are no changes to algorithms that can reduce the number of audience members and engagement you get. When using email, here are the kind of numbers you’ll want to track:
- Open rate: percentage of emails that are opened/read
- CTR (click-through rate): percentage of total emails sent where recipient clicked a link
- CTOR (click-to-open rate): percentage of total opens where recipient clicked a link
- Unsubscribers: how many people unsubscribe from your list after sending a campaign
- Bounce rate: how many emails in your list bounce (e.g. are bad or no longer work)
- A/B testing: the performance of different aspects of a campaign to gauge effectiveness. A good A/B test focuses on one element, keeping everything else constant. You might test two different email subject line, two different main images, email copy, or even different days.
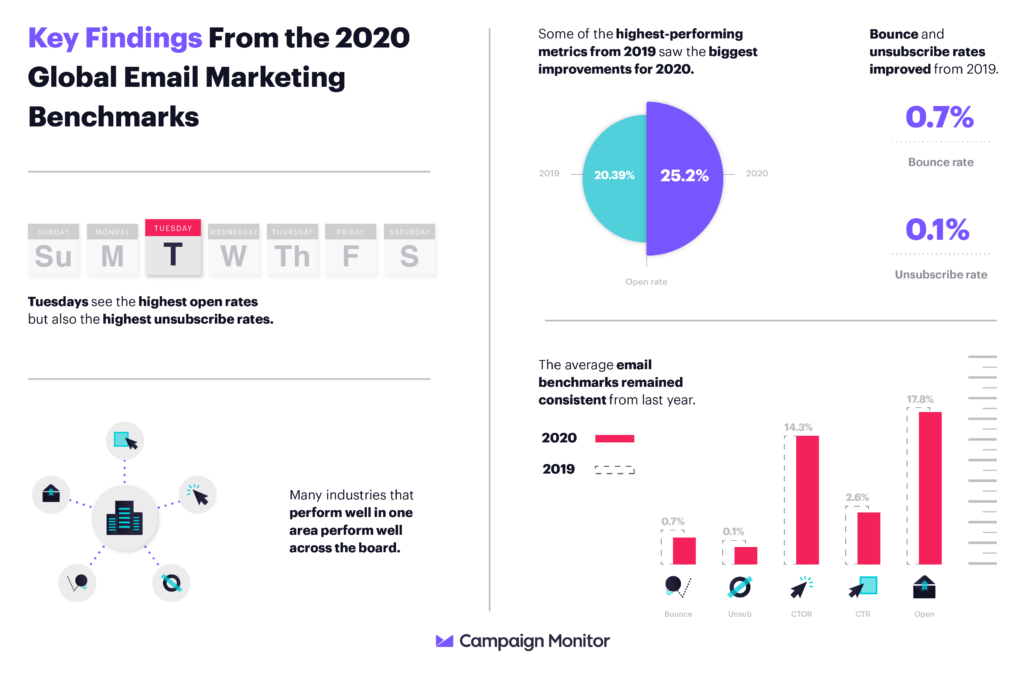
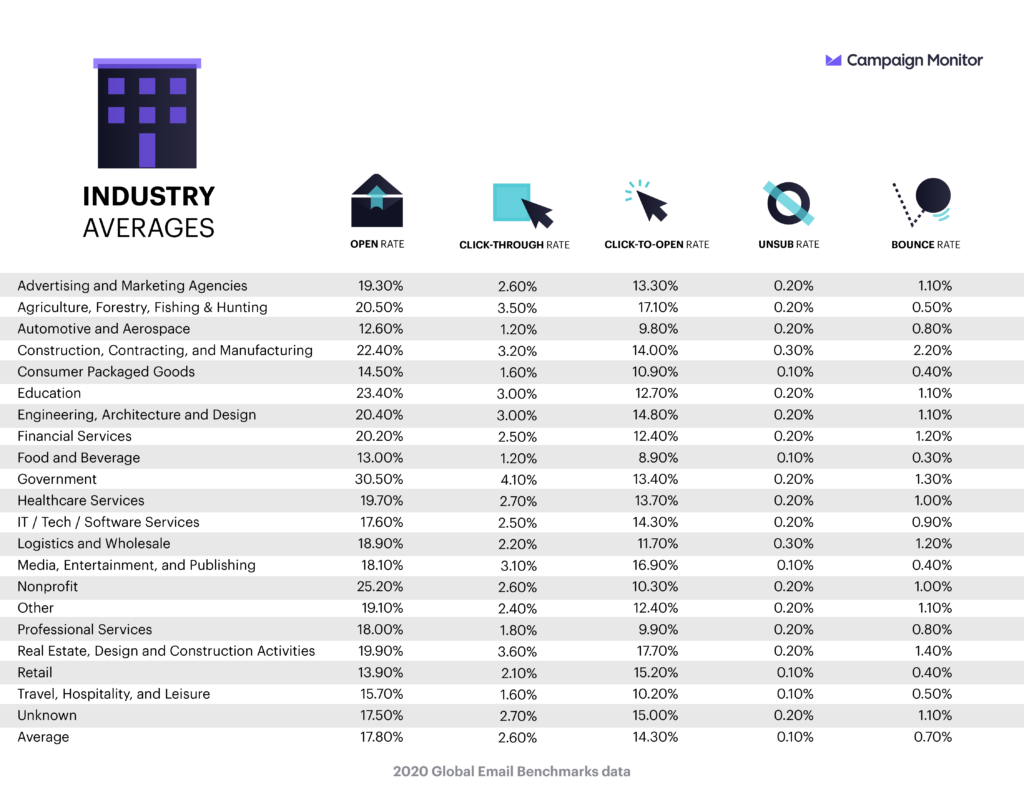
Campaign Monitor compiled 2020 benchmark statistics worth noting. Here are a couple of graphs:
Blogging
Like email, blogging is one of the oldest forms of content marketing, harkening back to the days of Blogger. As a platform and strategy, it’s come a long way since then. I would guess most of you reading this have some sort of online journal or blog. Important stats to measure include:
- CTR of individual links
- Percent of a post read (you might have to install a special plugin like Sumo
- Traffic to blog
- Traffic to individual posts
- Top ranking posts
- SEO ranking (knowing which keywords people are using to find your blog and where your blog ranks for those words)
- Inbound links (how many and where are they originating. Inbound links contribute significantly to SEO rank)
- Source of traffic (Google, ads, social media, etc.)
- Device (desktop, phone, tablet, etc.)
- Platform (browser, OS, etc.)
- Geographic source (top countries and other regional areas)
The benefit of many of these parameters is self-explanatory. Naturally, it’s good to know how many people are reading your blog, which blog posts are popular, and where most of your traffic originates. If a large percentage of your traffic comes from Google search, you might want to invest more in SEO or ad spending. Other important metrics like device and platform will give you valuable insights into the demographics of your audience.
Social Media
Last but certainly not least, you have to measure your social media engagement.
- Impressions
- Likes
- Shares
- Retweets
- Clicks
- Engagement (total number of Likes, Reshares,
- Engagement percentage (a percentage of likes and shares of total impressions)
As is the case with all content marketing campaigns, your objective will determine which measured parameters are the most important. Some business owners will put far too much emphasis or import on Likes and Reshares because they are the most visible and accessible, and to the untrained eye, their relative size (whether large or small) is given more weight than it should. A social media post for a blog article might be liked or reshared hundreds or even thousands of times, generating thousands of impressions; but if it has a relatively low CTR, those impressions might not move “the needle” towards your campaign objective. On the other hand, a well-crafted social media post that has a high CTR percentage, even with significantly fewer Likes for Reshares, could be 2-3x more effective.
One more to go
In the next and last installment of this content marketing series, we’ll cover something that many organizations and individuals don’t do, but absolutely should.

Filmtools
Filmmakers go-to destination for pre-production, production & post production equipment!
Shop Now


