The vertical bar graph raw exposure meter is the least explained meter in the latest RED manual. It’s also one of the most valuable exposure tools the RED ONE offers.
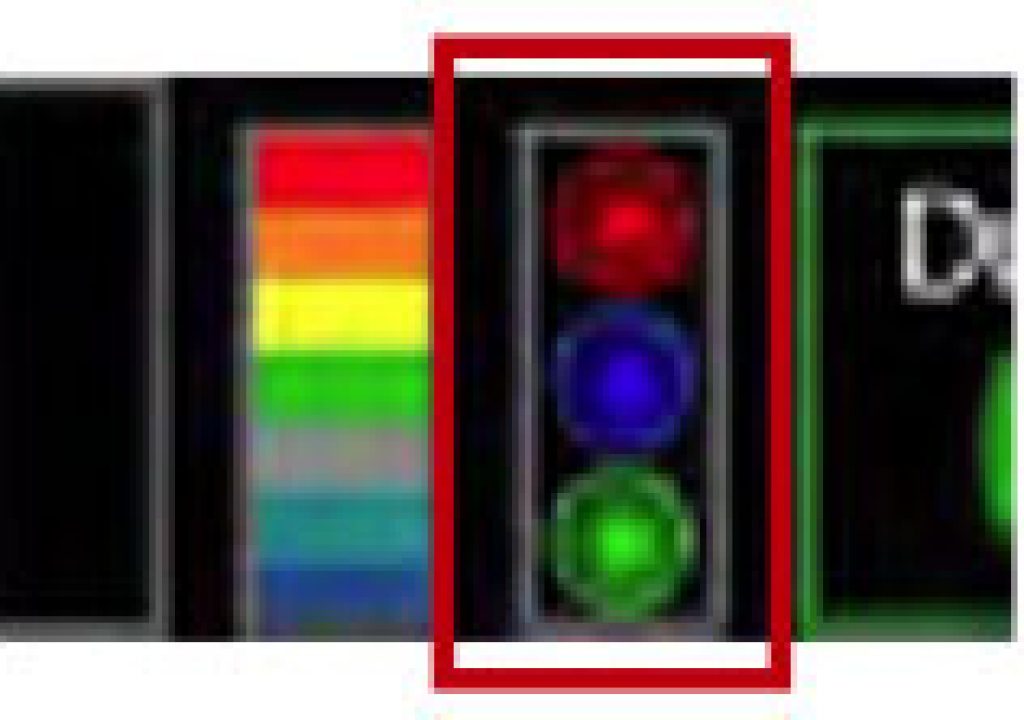
As English is my second language (and I haven’t discovered my primary language yet) I shorten “vertical bar graph raw exposure meter” to “barber pole.” It sits immediately next to the traffic light display in the viewfinder and on-board LCD:
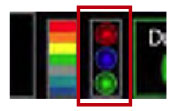
The circled meter is the traffic light. The barber pole sits immediately to its left. In the latest RED ONE manual (20.1.3) this is the closest I could find to a depiction of how it works. (I swear I found a little bit of an explanation in a previous manual, but I can’t find a single thing about it in this one.)
The RGB histogram is a great tool for judging exposure, as is the traffic light, but both are inextricably affected by the shooting gamma. For example, if I’ve chosen to shoot in RedSpace and I see a one of the traffic lights illuminate (indicating 1% or more of that color’s photosites are clipped), or a color channel clips on the RGB histogram, I can toggle into RAW mode and make both of those clips go away. Since RAW shows me what’s really going on, I can toggle back into RedSpace and rest assured that I’m not losing any important data.
It’s the same for false color mode, which may show me that I’m clipping highlights in RedSpace but then changes completely when viewed in RAW. I’d rather know what’s going on WITHOUT toggling into RAW, and the barber pole is that tool.
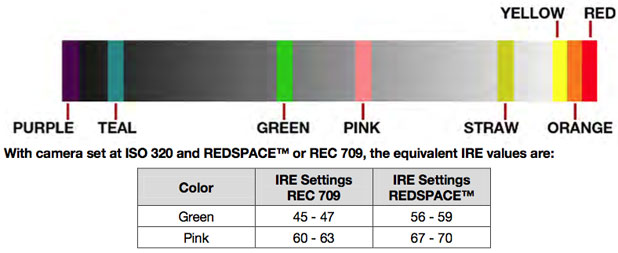
This chart, from page 44 of the RED ONE 20.1.3 user manual, shows the legend for false color mode. The barber pole works very similarly, with three important differences:
(1) There is no pink band representing flesh tone.
(2) There is no straw band indicating “two stops over reference” (presumably 18% gray).
(3) The barber pole always always always displays information about RAW data. It is not affected by your gamma choices.
When 2% of the photosites on the sensor reach a value that RED considers to be the equivalent of 18% gray, the green band appears.
When 2% of the photosites on the sensor reach a value that is 2/3 stop below saturation (“clipping”), regardless of color channel, the yellow band appears.
When 2% of the photosites on the sensor reach a value that is 1/3 stop below saturation (“clipping”), regardless of color channel, the orange band appears.
When 2% of the photosites on the sensor reach a value that is fully saturated (“clipping”), regardless of color channel, the red band appears.
For those of us who expose to the right, the optimal exposure illuminates the orange band without activating the red band.
The barber pole gives just enough information without giving too much: between 18% gray (green) and clipping (red) there’s really not much you can judge from a small striped meter, so it doesn’t bother you with intermediate steps like flesh tone (pink). As long as your exposure falls between 18% gray and 2/3 stop below clipping it just leaves you alone. I like that. It only grabs your attention when you’re getting close to losing highlight detail, which is all we really care about in a raw “color grade it later” world.
So if you expose the RED as I do–boosting the exposure as high as possible for maximum latitude and minimum noise in post–keep an eye on the barber pole. It’s the one tool I’ve found that is consistent with what is really going on under the RED ONE’s hood.
Art Adams is a DP who describes himself as “bright.” His web site is at www.artadams.net.

Filmtools
Filmmakers go-to destination for pre-production, production & post production equipment!
Shop Now