https://www.youtube.com/watch?v=COf8tT4E-fw&feature=youtu.be&a
This week on MacBreak Studio, I show Steve Martin from Ripple Training how to build an animated 3D bar chart in Motion.
There are times when an editor or motion graphics artist needs to present data, and bar charts are a common method for showing how values change over time. A 3D chart can be more visually compelling, and animating it can draw your viewer’s eyes to what you want them to notice.
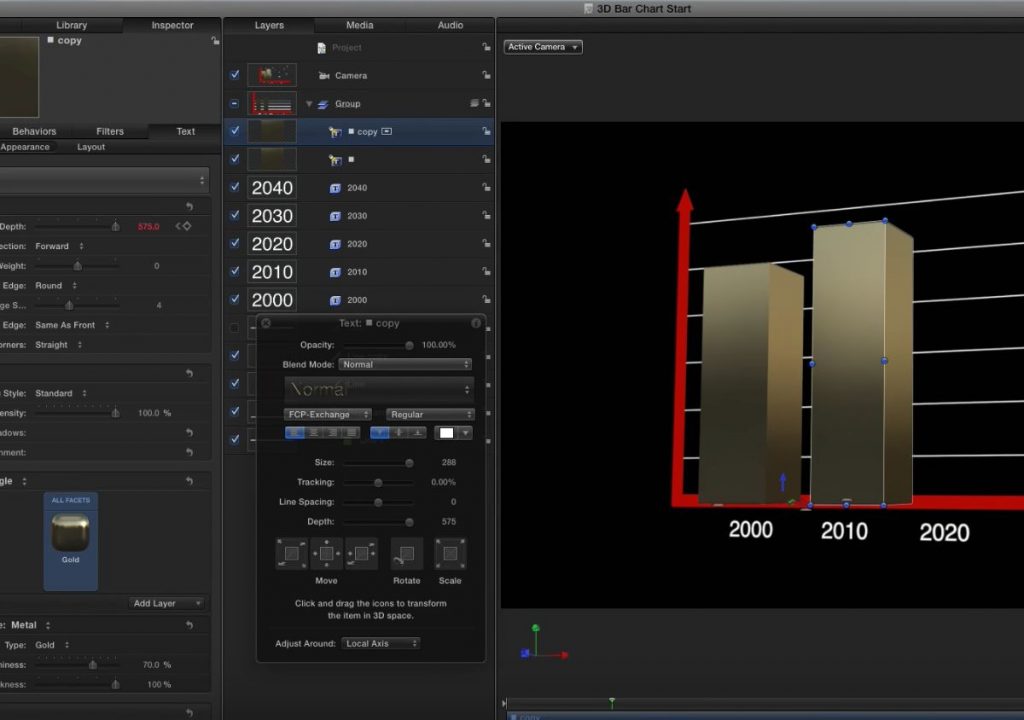
In today’s episode I build this animated 3D bar chart from scratch in order to demonstrate several concepts and features of Motion that can be applied to other types of projects. I start by using the Line tool to draw the axes of the chart. Then, I use a Replicator to create the gridlines. I add value text fields along the X-axis, using the Align and Distribute commands to space them equally along the same horizontal row.
For the bars, I start with a rectangle shape and demonstrate how you can create a “faux” 3D effect on the bar by using the Extrude filter. This filter creates a convincing illusion and is very flexible – until you add a camera to the scene and move it around, at which point this approach breaks down.
So instead, I turn to Motion’s only “true” 3D object – 3D text. By using symbols instead of fonts, you can create an astonishing variety of objects and add materials and lighting to them. In this case we settle for a simple solid rectangle shape, rotate it 90 degrees on its X-axis to lay it flat as the base of the column, and then use the Width parameter to make the column extend upwards.
For a material, I follow Steve’s recommendation and use the Gold preset material, and then I animate the bar by keyframing the same Width parameter. Check it all out above, and if you want to learn more about how to leverage Motion’s 3D space to create useful things, we have you covered.

Filmtools
Filmmakers go-to destination for pre-production, production & post production equipment!
Shop Now


