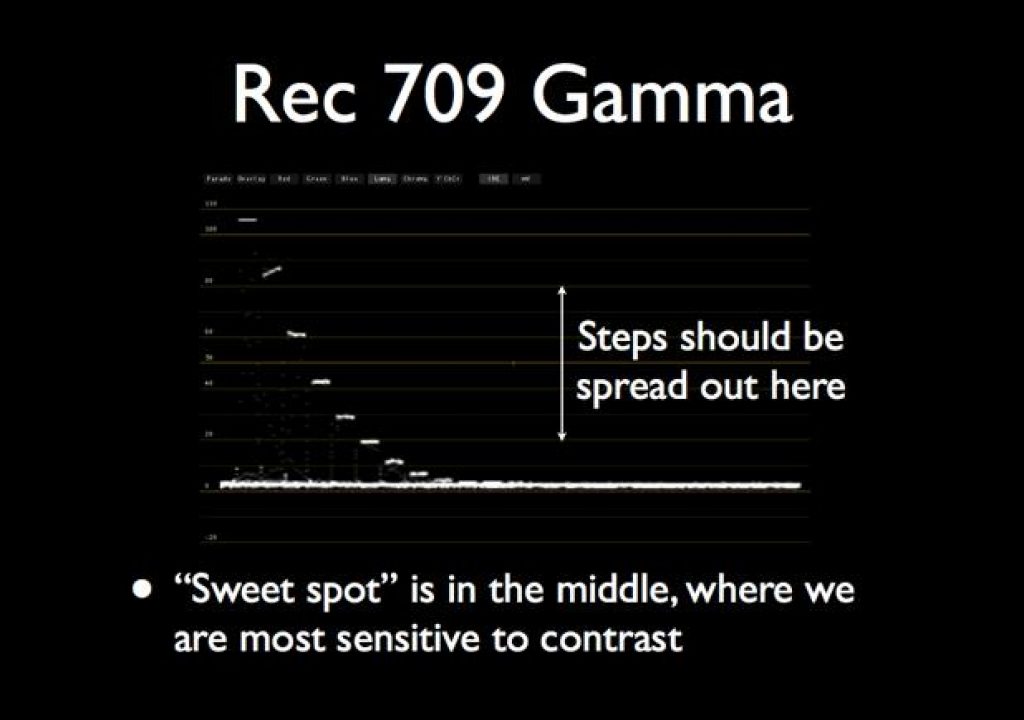
After years of looking at dynamic range charts I noticed that almost all camera gamma curves emphasize mid-tones within a consistent IRE range. What does this mean to you? Find out by clicking through…
As a consultant to DSC Labs I get to play with a lot of toys, and one of the best is the DSC Xyla 20-stop dynamic range chart. This chart tells me more about how a camera works faster than any other method I’ve found. Ultimately real world use is the real test, but being able to see a visual representation of a camera’s dynamic range is the kind of thing that gives me confidence when using a camera for the first time.
Here’s some very old footage I captured using an Arri Alexa and DSC Labs’ old 102db dynamic range chart last year:

This is what the image looked like when capturing in Log.

This is what the waveform monitor looked like.
As you can see, each step–which equals one stop–is equidistant from the others. This is not the way cameras see the world, and it’s especially not the way images are meant to be viewed on monitor, but Log is a storage format only, and these equidistant steps give a colorist the most information possible from which to build a look. As you can see information is available right up to the edge of clipping and down to the top of the noise floor. (The way the curve rolls off at the bottom is a side effect of how sensors react at low light levels.)
In the top image you can see that every step is preserved right up to the first chip, which is blown out. (This chart is meant to be used by clipping the first chip and counting down from there, as the only consistent reference point we have with any sensor is where it saturates, or clips.)
Here’s the same chart but captured with the Rec 709 curve enabled:


That’s a really dramatic change. What you’re seeing here is a typical “S-curve” gamma curve, named after the “S” shape you can see on the waveform monitor. Everyone who has seen a Log-captured image knows that it looks flat, but after grading it looks “normal.” That’s because the first thing a colorist does is to remap where the highlights, shadows and mid-tones fall by applying an S-curve.
The reason they have to do this is because a camera like Alexa, which captures 14 stops of dynamic range from brightest highlight to darkest shadow, has to cram all of its image information into the Rec 709 HDTV “bit bucket.” (The bit bucket, a term coined by a DIT who came out of ILM, is the range from 0 to 109 IRE on a waveform monitor. That’s the space in which all your picture elements must fall in order to be visible on an HDTV monitor.) The problem is that the Rec 709 bit bucket was only ever designed to hold about six stops of dynamic range, and cramming 14 stops into it without a applying an S-curve means the steps are too close together to look right on a Rec 709 display. If your final viewing range is only six stops, but you cram 14 equidistant stops into it, you’ve reduced the contrast by a little more than half: instead of six stops of dynamic range in a six stop bit bucket, you now have 14 stops in a six stop bit bucket. That means that each stop is now 50% closer to the ones on either side of it, and that reduces contrast in the image to the point where it looks flat.
The S-curve does what our eyes do naturally: it stretches out the mid-tones, so they are the same distance apart that they would be if the camera only captured six stops, and compresses the highlights and shadows, which is where our eyes are least sensitive to differences in tonality. We can cram the steps together in the highlights and shadows, making them less contrasty, because the mid-tones are where we pay the most attention.
Here’s a graphic showing how the steps are mapped from Log to Rec 709:
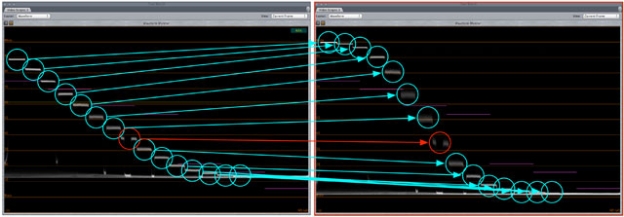
The mid-tones are pulled apart, and the highlights and shadows are pushed together.
I created these graphics for a presentation I gave about the Sony FS700 at CineGear this year, using the DSC Labs Xyla-21 chart:
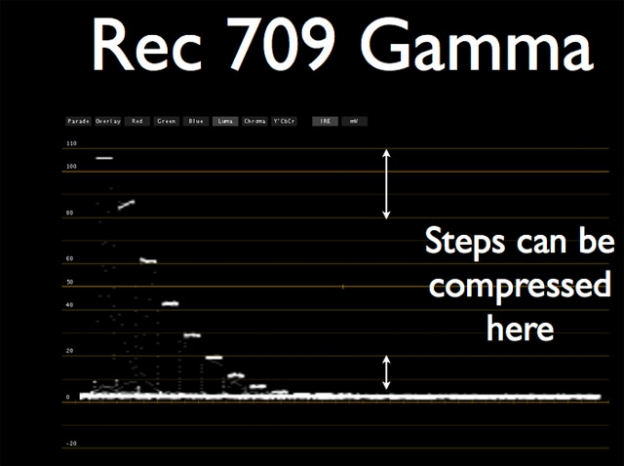
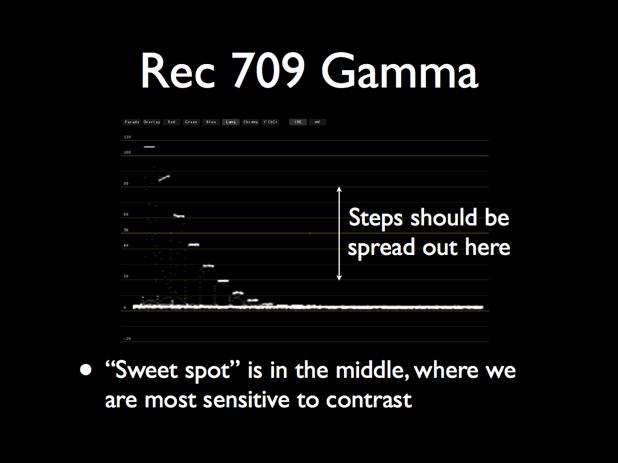
The mid-tone sweet spot seems to be between 20 IRE and 80 IRE. Below 20 IRE the sensor gently rolls off shadow detail into the noise floor, with the steps coming closer together as the image rolls off into darkness. Above 80 IRE and the curve gradually compresses highlights and desaturates highlights until they roll off into clip.
In between 20 IRE and 80 IRE the one-stop steps are pulled apart so they are spaced the same distance apart as if they were captured by a camera with a six-stop dynamic range. This is where most important detail in an image falls, such as flesh tone highlights (50-70 IRE). Flesh tone above 80 IRE looks good on some cameras and not so good on others, so when shooting in situations with extreme highlights its good to know how well your camera handles them. The Arri Alexa handles hot skin tone brilliantly. The Sony F3 does not, although the FS700 does. The Canon C300 does well using some gamma curves, but not others.
Here’s an example of S-curve compression in the FS700:
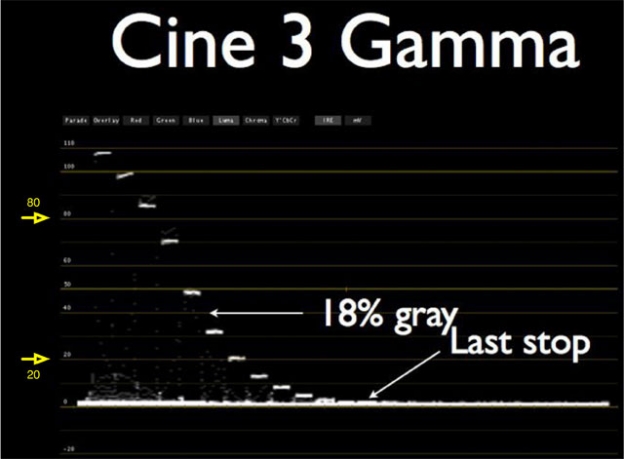
The Rec 709 curve only shows three steps until hitting clip; Cine 3 shows about four and a half. There are still only about four steps in the range between 20 IRE and 80 IRE, but the step that used to be at 40 IRE has been pulled up by one-and-a-half stops. This is the same as “pushing” film, or adding gain, although the actual ISO of the camera hasn’t changed. The gamma curve simply remaps the values, putting 1+ more stops of highlight detail above 40 IRE and reducing the steps between the top steps to fit it in. The shadows will be a touch noisier due to the lower steps being pulled up a bit, but cameras are so quiet now that the increase in shadow noise is minimal.
As long as the steps between 20 IRE and 80 IRE are spaced apart–or “S-curved”–the image will look “normal.”
I’m not saying that you should use this as a formula for all your shoots. I just want to make you aware that crucial detail will image more clearly if it’s placed +2/-2 stops from middle gray. What goes into that range is strictly an artistic choice. This information could be helpful when prelighting a set without a camera present, but ultimately the choice of where values should fall in a scene should be determined by the content and emotion of the script.
Disclosure: I have worked as a paid consultant to DSC Labs.
Art Adams | Director of Photography | 12/24/2012 | www.artadamsdp.com

Filmtools
Filmmakers go-to destination for pre-production, production & post production equipment!
Shop Now