Years ago I wrote an article describing how log encoding works using Sony’s S-Log as an example. Sony’s S-Log2 is coming down the pike in a big way in their F5 and F55, so it seems like an appropriate time for an update.
First of all, I should warn you that this is a much, much simpler article than the last one. Occasionally I’m accused of being too obtuse, so I’m going out of my way not to go that direction. I suspect this will be easy because my knowledge of log curves stops at the line where math starts. Thanks to a nifty new program I recently bought, OmniGraffle Sketcher, I can illustrate how log works without having to bother either of us with equations or references to exponents.
Well… there may be one or two references to exponents. Stay with me.
In its simplest sense gamma describes how tones are mapped into a range of values between maximum black and maximum white. (This isn’t perfectly correct but it’s the way gamma is most commonly understood.) Let’s assume a video image is encoded in 10 bits per color channel, which means that red, green and blue each have a maximum possible value of 1024 and a minimum possible value of zero. (The actual values are different, but I’m rounding off for simplicity.)
When a photosite is hit with as much light as it can stand it outputs a voltage that is converted by the camera’s analog-to-digital converter into the maximum brightness code of 1024. If that photosite is struck by half that much light it reports a voltage that is translated into value 512. Half of that much light is reported as value 256.
Do you see a pattern here? Nearly everything in photography relating to exposure is doubles and halves, and in this case halving the number of photons striking a photo site results in that photo site reporting half the light–or one less stop–from the previous value. The code value for the next stop down from 256 is 128; from 128 is 64; from 64 is 32; from 32 is 16; etc.
Here’s how that looks on a graph:
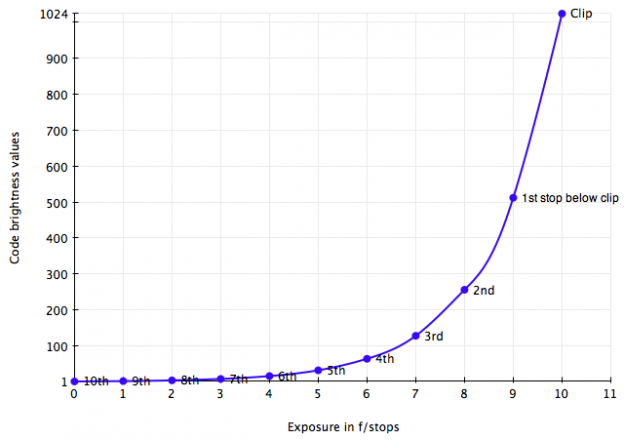
What you’ll notice is that the graph drops off really, really quickly at the highlight end (right side) of the curve. The top code value of 1024, representing the brightest highlight, plunges to 512 over a difference of one stop. If you’re storing raw values that means that 512 steps of brightness in the range of 0-1024 represents only one stop of brightness. Half of a photosite’s raw signal is dedicated to extreme highlights that most of us try to avoid and that usually take up a very small area of the frame.
Raw files tend to result in very pretty graded images, but they also waste a huge amount of storage space.
By the way, this is called linear gamma. When linear gamma is viewed on a Rec 709 monitor it looks really dark, and now you can see why: the midtones are buried way down the curve, making them appear much too dark.
Okay, this is where math comes in. During the linear gamma to log gamma conversion these code values are run through some sort of mathematical equation that redistributes them such that each stop difference in illumination gets the same amount of storage space. I’m not going to say that I know the math involved because I don’t–not completely–and if I try to explain it I’ll just end up making a fool out of myself. Suffice to say it has something to do with exponents. (See? I told you I’d mention those again.)
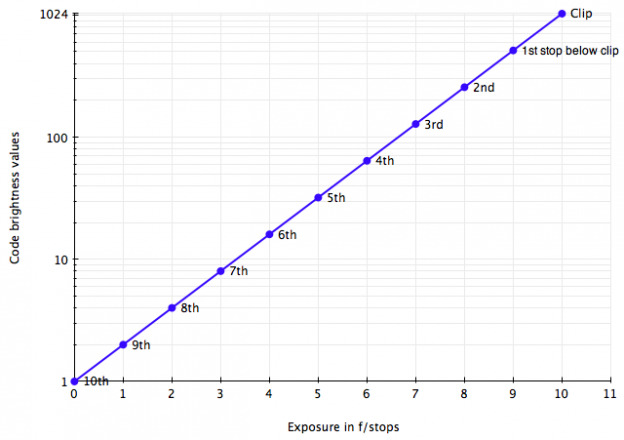
Fortunately the graphing program I use has a very interesting feature: a function that turns this linear curve into a logarithmic curve. Clicking that one button turns the graph into this:
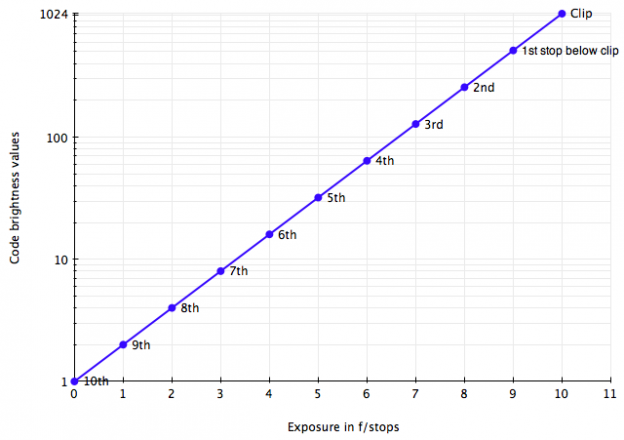
That’s the exact same data encoded in log format. It’s quite different, isn’t it? Our hypothetical camera’s dynamic range is now captured in perceptually equal steps, roughly how our eyes see the world. Each stop is allocated the same amount of space, and a colorist has easy access to the last bit just before the line runs out at either end. Not all the data from the raw recording is preserved, as it is in this graph; there’s no need to save so much extreme raw highlight detail, for example, so a certain amount of that is discarded. What’s left is more than enough to count as a digital negative that can be graded just as film can.
Now, manufacturers do mess around a bit with these curves so this explanation isn’t a perfect one. For example, when S-Log was first released it had an interesting characteristic, common for a log curve, that the closer a value got to black or white the harder it had to work to get there. This had the result that brightness values almost never ran to the dynamic range limits because the formula just didn’t allow them to get there. It’s a bit like trying to get somewhere by covering half the distance, then covering half that distance, then covering half that distance again… if you only ever move half the remaining distance to your destination then technically you’ll never get there.
Because code values never quite reach the extremes of black and white S-Log looked really flat because normal shadow values in a scene never reached the minimum code number for black. For that reason they looked too bright, or milky. S-Log2 appears to rectify that problem by storing shadow values farther down the curve so that the darkest tone the camera can possibly see is mapped very close to the log curve’s minimum recordable value. By making blacks black again the log image actually looks fairly normal on a Rec 709 monitor. The highlights are still crushed because they are heavily compressed by the log curve for grading, but the image otherwise looks “real.” It’s less likely to cause people to panic when walking by the DIT’s monitor.
According to Charles Poynton it’s possible to effectively record about 99% of the information contained in a 12-bit raw file in a 10-bit log file. Yes, you’re throwing some information away, but do you really need all the highlight information that a raw file records when you’ll never use it? You’re most likely to throw most of that extra detail away when you roll off the highlights in the grading process. Highlight detail doesn’t require that much storage space as highlights are always heavily compressed anyway. Our eyes just don’t see that much detail in bright highlights. (There’s a brief discussion of how many steps you need to transition from black to white in linear vs. non-linear gamma here.)
That’s the short version of what a log curve is and how it works. Raw seems to be the buzzword of the day, and everyone wants to shoot raw for optimal picture quality, but the storage requirements for raw are pretty sobering. Log is a perfectly viable alternative that is much more efficient overall and certainly more post production friendly. There are certain requirements to recording log that are different to recording in raw: for example, you must white balance the camera in log whereas in raw the white balance is encoded in metadata as a changeable option… but any competent cinematographer should be able to white balance a camera.
ADDENDUM: A reader points out that some “raw” cameras create log-encoded raw files, so it’s not always as simple as log vs. raw; you have to figure out what kind of raw you’re working with. Yay!
02/06/2013
Art Adams
Director of Photography
www.artadamsdp.com
Twitter: @artadams

Filmtools
Filmmakers go-to destination for pre-production, production & post production equipment!
Shop Now