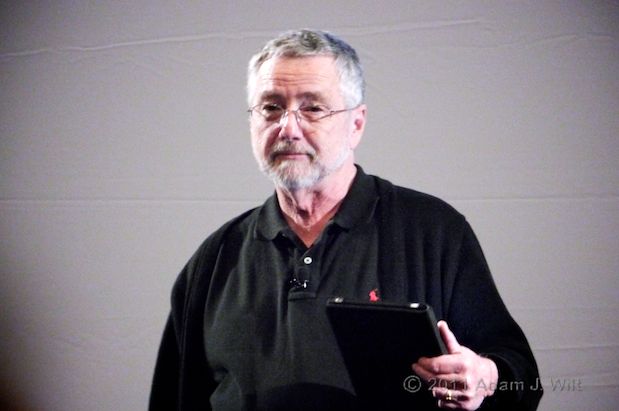
SCCE test director Robert Primes, ASC.
Steve Hullfish has already nicely described the Single Chip Camera Evaluation that Robert Primes, ASC organized at Zacuto’s behest. I just have a couple of comments to add, along with images of the three charts of actual numbers that emerged from the tests.
“Wow, numbers!”, I hear some folks thinking, “now we can find out which camera is best!” And it’s true that some folks will use these charts the way a drunk uses a lamppost—for support, rather than illumination. But I caution you to avoid reading more into these charts than they convey: while they provide a useful means of comparing and contrasting the relative performance of specific aspects of various cameras, they do not—and cannot—state the One True Number for any of these performance metrics. The methods used for coming up with these numbers haven’t been published, and actual numbers are very dependent on methodology.
Also, I’m going to nitpick some of the numbers and critique the results. I do not mean to imply that the tests were flawed; far from it. These tests appear to have been very well designed and carefully executed (Mike Curtis estimates that 5000-6500 man-hours of work were put into the effort by everyone concerned; this was no slapdash hack-job). All my critique is intended to do is to keep folks from reading more into the tests than is sensible or practical, and to wait for publication of the full test methodology before taking the exact numbers as any sort of gospel.
And really, the numbers aren’t that important. You need to see the recorded images to get the true picture (sorry) of how the cameras actually performed.
With those caveats, let’s proceed…
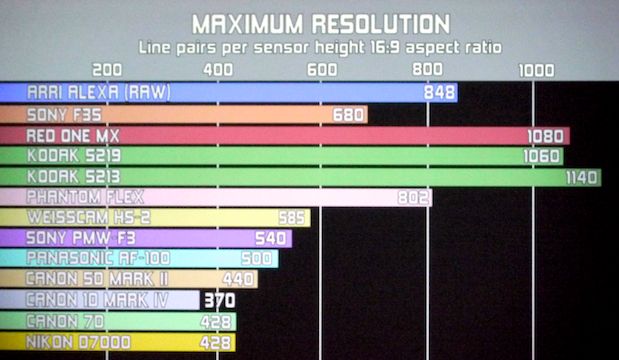
Camera resolutions compared (note: resolution does not equal perceived sharpness).
The chart lists line pairs per sensor height; the more traditional video measurement is “TV lines per picture height”, or TVl/ph. A “TV line” is half a line pair, so double the numbers shown to get TV lines.
The cameras were measured on a native-sized image, so a 4K camera like the RED ONE will show a markedly better number than an HD-native camera like the F3. However, there are anomalous numbers here: the F35 is an HD-native camera in terms of its output, so it should top out at 540 lp/ph or 1080 TVl/ph; any detail seen at 680 line pairs should be well into the aliasing frequencies. Likewise, the Alexa is shown to resolve 848 lp/ph in 16×9 mode, or 1696 TVl/ph; Arri says their sensor is 2880×1620 in 16×9 mode, so a 1696-line resolution would definitely be out there in false detail territory due to aliasing (not that the Alexa is especially prone to aliasing, mind you, though like most single-sensor cameras there’s a bit if you push it hard enough).
Furthermore, some of the digital cameras have markedly different resolutions in the H and V directions, especially the DSLRs (have a look at some typical samples to see the problem). The chart shows one number for a given camera, and it doesn’t say what direction that number was measured in.
None of which is meant as a criticism of the resolution test: when the Image Quality Geeks publish their methodology, we can see how the numbers were determined. The important take-away is that, generally speaking, what we saw in the real-life scenes shot with these camera correlated pretty closely with what the chart shows: Cameras with longer bars generally resolved finer detail.
And in this case, for the most part, max resolution was a pretty good proxy for perceived sharpness, too, though the film looked a bit softer than the digital cameras with comparable resolution numbers (which is perfectly normal; the MTF curve for film typically drops off fairly quickly relative to its limiting resolution, whereas solid-state electronic sensors tend to have high MTFs through their resolution ranges, with a sharp drop at the limiting resolution, and often with spurious detail due to aliasing past that point). Looking at real-world pix, the DSLRs were visibly softer—but even there, that was mostly noticeable on fine detail in wide shots, and only because the test intercut sharp and not-as-sharp cameras back-to-back.
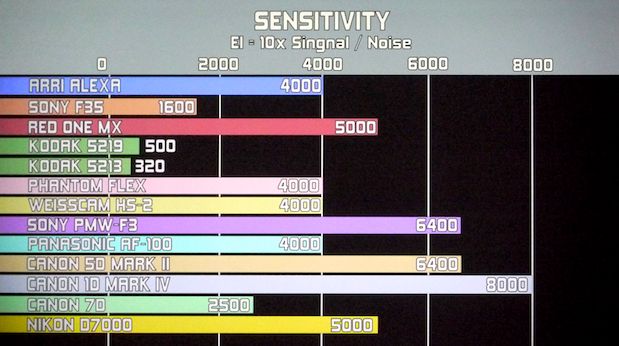
Maximum usable sensitivities compared.
Again, we need to see how the sensitivities were measured. I’m not sure I’d pick the RED ONE M-X over Alexa for low-light work, for example, and I’m puzzled that the two film stocks are shown at rated values only; I’m sure both emulsions can be pushed a couple of stops.
As to sensitivity rating in general, Steve writes in his article:
One bone of contention in determining ISO is whether the rating for ISO should JUST be based on the 18% gray, or should you rate a camera as having a higher ISO if it is able to deliver greater headroom (in stops) ABOVE 18% gray?
Primes disagrees that “video” cameras should even have ISO ratings because the curve is not the same as with film, so the ways to expose film based on ISO and an EI (exposure index) rating from a light meter are very different than video. Primes thinks that a video camera should really be rated and have exposure determined based on waveform monitors.
It’s worth looking at how Arri rates the Alexa:
![]()
Alexa’s EI ratings, from Arri’s camera specs webpage.
Arri very sensibly shows that the camera can be used at a variety of ratings, simply trading off highlight headroom against noise-limited shadow latitude (“footroom”). If you balance the two, Alexa is an EI800 “native” camera; the RED ONE M-X also works out to about EI800 “natively”.
Of course, with a raw camera and a set of curves, you can pretty much trade off headroom for footroom as you see fit—indeed, there’s much discussion as to the “proper” EI for these cameras, depending on one’s tolerance for shadow noise vs. highlight clipping.
Cameras that hand you more processed images, whether in log form or in Rec.709, may conceal (or even throw away) the extremes of the tonal scale. The AF100, for example, pretty much shows the same headroom and footroom no matter what ISO rating you set for it: between its 709-like gamma curves, its hard knee, and its 3D noise reduction, changing ISOs varies its noise texture, but not much else about the image seems to change!
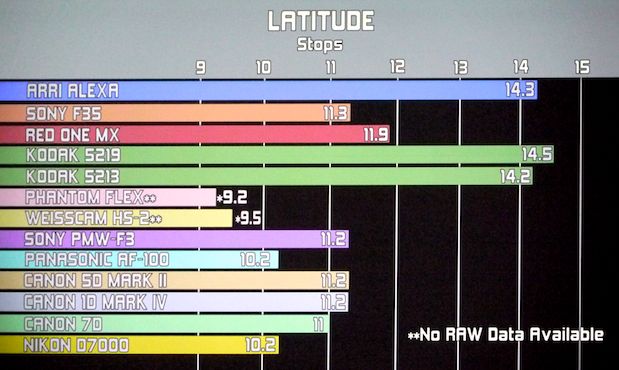
Latitude compared (note: non-zero-based scale; bar lengths are not proportional to values).
First: the Kodak stocks and the Alexa are not twice as good as the Phantom and the Weisscam, as the chart would indicate at first glance; the chart’s left-hand side is not at zero stops of latitude, but at six stops. Kodak and Alexa do indeed have some five stops more latitude than the most contrasty cameras used, but those contrasty cams still have 9+ stops, which is a good deal better than a poke in the eye with a sharp stick by anyone’s reckoning.
Quibbles about the chart aside, the more latitude the better when it comes to handling extremes of light and shadow. More latitude certainly gives you more leeway to screw up (grin). But when you have controlled lighting conditions, even a relatively contrasty camera such as the AF100 does a fine jobin the hands of an experienced DP like Art Adams.
All in all, it’s best to keep in mind that these charts show only three, very limited aspects of all these cameras. They don’t show the tradeoffs between highlight handling and shadow detail; the varying aliasing behaviors; how the different cameras handle saturated colors as highlights start to blow out; how their levels and textures of shadow noise differ; how they handle skintones and the wrapping of light around faces and hands.
Beyond that, as the testers rightly mention, image rendering is only one set of factors in choosing a camera for a job. Size, weight, cost, availability, familiarity, and lens options all matter just as much in the real world. There is no overall winner, just a choice of the right camera for any given job.
The best image of the DSC Labs Wringer chart used to thrash the cameras in their renderings of colored details is at B&H.
Stills from the tests (which are really all you need to see, as there was nothing significant in the moving images that won’t be visible in extracted stills), along with notes on the test methodology, are supposed to be posted at http://thescce.org/ at some point in the future; currently there’s just a press release announcing the NAB demo (in web-unfriendly Microsoft Word format). There was talk of a Blu-Ray disc of the show being produced as well, but neither the SCCE site nor Zacuto’s Great Camera Shootout of 2011 page has any further details regarding such a thing.
The Zacuto website also says, “we are planning screenings in New York and Los Angeles so keep your eyes on the Zacuto website for details. You can also see the final version of the tests in the Great Camera Shootout 2011 scheduled to hit the web in June.”
It’s best to just keep checking the SCCE and Zacuto sites for updates.
(The “drunks and lampposts” line is taken from a famous statement about statistics, attributed variously to Sir Winston Churchill or Scottish writer Andrew Lang. Lang predates Churchill, so my vote is on Lang, grin.)
FTC Disclosure
I attended NAB 2011 on a press pass, which saved me the registration fee and the bother of using one of the many free registration codes offered by vendors. I paid for my own transport, meals, and hotel.
No material connection exists between myself and the National Association of Broadcasters; aside from the press pass, NAB has not influenced me with any compensation to encourage favorable coverage.
Filmtools
Filmmakers go-to destination for pre-production, production & post production equipment!
Shop Now